Chinese Journal of Vector Biology and Control ›› 2023, Vol. 34 ›› Issue (6): 788-793.DOI: 10.11853/j.issn.1003.8280.2023.06.015

• Technology and Method • Previous Articles     Next Articles

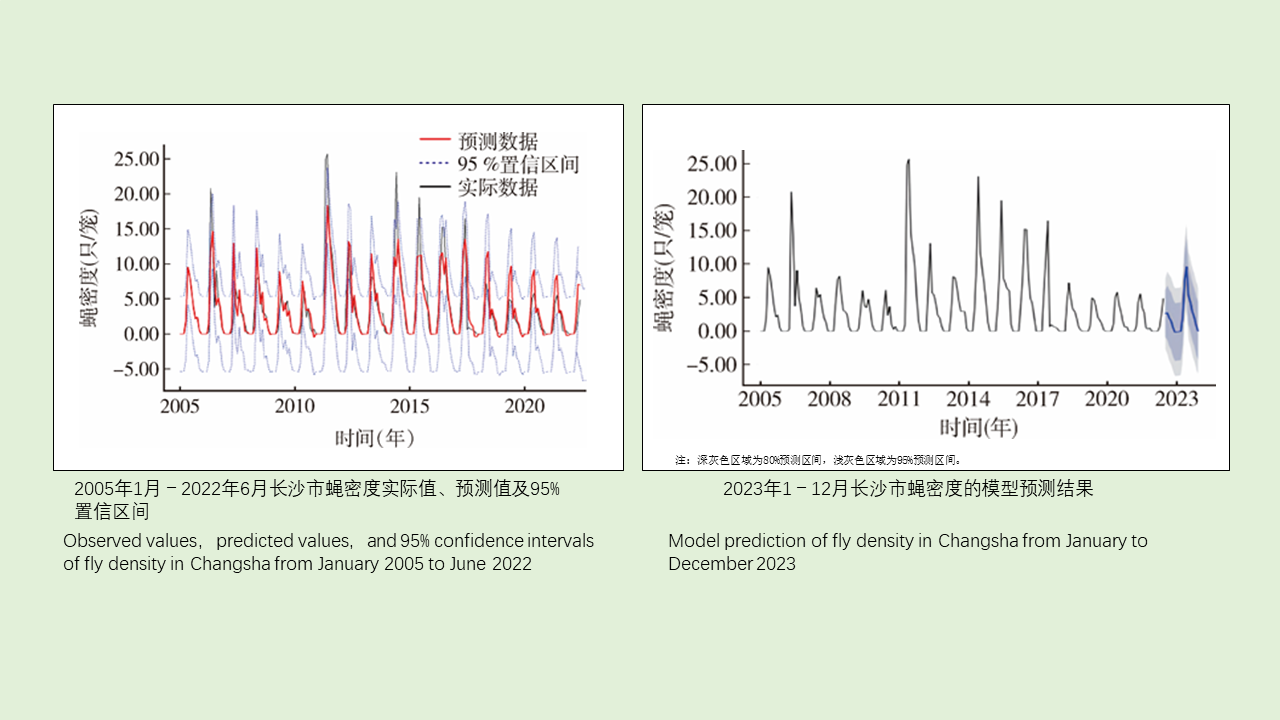
Fly density prediction based on autoregressive integrated moving average model in Changsha, China

XIAO Shan, CHEN Jian-yong, LIN Bin, LONG Jian-xun, PENG Lai, ZHU Cai-ying   

  1. 1. Department of Disinfection and Vector Control, Changsha Center for Disease Control and Prevention, Changsha, Hunan 410005, China
  • Received:2023-05-15 Online:2023-12-20 Published:2023-12-26
  • Supported by:
    Scientific Research Project of Hunan Provincial Health Commission (No. 202212053446)

自回归积分移动平均模型在长沙市蝇密度预测中的应用

肖珊, 陈建勇, 林斌, 龙建勋, 彭莱, 朱彩英   

  1. 1. 长沙市疾病预防控制中心消毒与病媒生物防制科, 湖南 长沙 410005
  • 作者简介:肖珊,女,硕士,公卫主管医师,主要从事病媒生物防制工作,E-mail:514279051@qq.com
  • 基金资助:
    湖南省卫生健康委科研计划课题(202212053446)

Abstract: Objective To construct an autoregressive integrated moving average model (ARIMA) of fly density in Changsha, China and to predict the fly density from January to December 2023.Methods Using the R 4.3.0, an ARIMA model was constituted with the fly density data from January 2005 to June 2022. The predicted values were compared with the observed data of July to December 2022 to evaluate the prediction effect of the model. The fly density from January to December 2023 was predicted.Results The ARIMA (1,0,0)(0,1,1)12 model was optimal with the fly density data from January 2005 to June 2022. The model showed the lowest Akashi information criterion value and Bayesian information criterion value, which were 986.50 and 996.37, respectively. The residual sequence was a white noise sequence, suggesting that the model was valid. The predicted values of fly density from July to December 2022 were basically consistent with the observed values, with the observed values falling into the 95% confidence interval of the predicted values. The root mean square error was 0.649 and the mean absolute error was 0.522. Therefore, the model can be used for short-term prediction of fly density. This model was used to predict the fly density from January to December 2023. The mean density was 2.89 flies/cage in 2023, which was lower than the mean density in 2005-2022 (3.22 flies/cage) but higher than the mean density in 2022 (1.20 flies/cage).Conclusions The ARIMA (1,0,0)(0,1,1)12 model shows high goodness of fit for the fly density data in Changsha, and can be used for the short-term prediction of fly density. The predicted data can be used as a basis for the prevention and control of fly hazard events and fly-borne diseases.

Key words: Fly density, Surveillance, Autoregressive integrated moving average model, Prediction

摘要: 目的 构建长沙市蝇密度自回归积分移动平均模型(ARIMA),并对2023年1-12月蝇密度进行预测。方法 应用R 4.3.0软件对2005年1月-2022年6月的蝇密度数据构建ARIMA模型,将2022年7-12月预测值与真实值进行比较,进行模型预测效果评价,进而对2023年1-12月蝇密度进行预测。结果 采用ARIMA模型对2005年1月-2022年6月蝇密度监测数据构建,选取最佳模型为ARIMA(1,0,0)(0,1,1)12,其赤池信息准则(AIC)值及贝叶斯信息准则(BIC)值均最低,分别为986.50及996.37;模型残差序列为白噪声,模型有效;预测2022年7-12月的蝇密度与实际密度基本一致,实际监测值均落入了预测值的95%置信区间内,均方根误差(RMSE)为0.649,平均绝对误差(MAE)为0.522,可用于短期蝇密度预测。利用该模型预测2023年1-12月蝇密度,其密度平均值为2.89只/笼,低于2005-2022年平均密度(3.22只/笼),高于2022年平均密度(1.20只/笼)。结论 ARIMA(1,0,0)(0,1,1)12模型对长沙市蝇密度数据的拟合效果较好,可用于蝇密度的短期预测,为预防控制蝇类危害事件及蝇传疾病提供依据。

关键词: 蝇密度, 监测, 自回归积分移动平均模型, 预测

CLC Number: