Chinese Journal of Vector Biology and Control ›› 2023, Vol. 34 ›› Issue (4): 457-461.DOI: 10.11853/j.issn.1003.8280.2023.04.003

• Special Topics|Vector Surveillance in Shanghai • Previous Articles     Next Articles

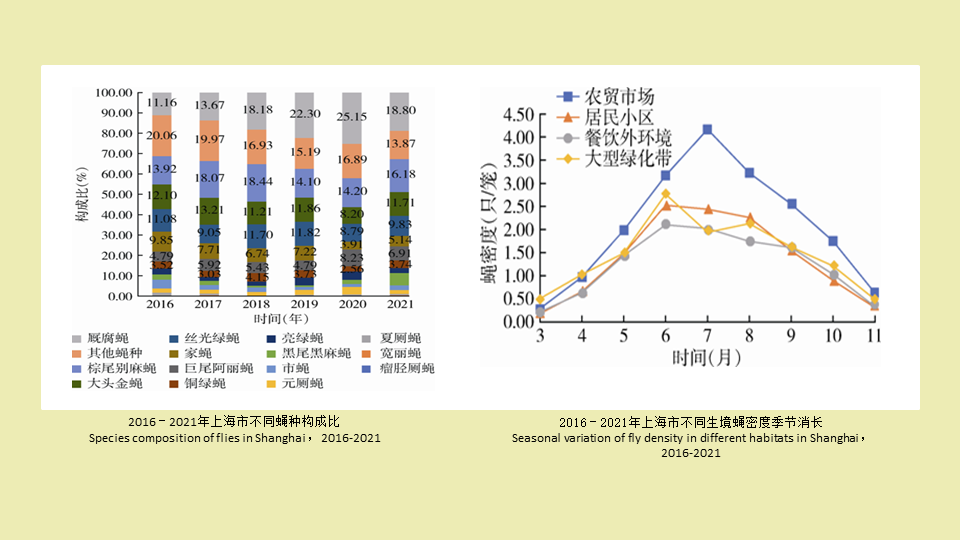
An analysis of fly ecological surveillance results in Shanghai, China, 2016-2021

Jing-jing WANG(), Jing-qiu XU(), Jiang ZHU, Hong-xia LIU(), Pei-en LENG()   

  1. Department of Vector Control, Shanghai Municipal Center for Disease Control and Prevention, Shanghai 200336, China
  • Received:2023-02-16 Online:2023-08-20 Published:2023-08-17
  • Contact: Hong-xia LIU, Pei-en LENG

上海市2016-2021年蝇类生态学监测结果分析

王静静(), 徐劲秋(), 朱江, 刘洪霞(), 冷培恩()   

  1. 上海市疾病预防控制中心病媒生物防治科, 200336
  • 通讯作者: 刘洪霞,冷培恩
  • 作者简介:王静静,女,硕士,助理工程师,主要从事病媒生物防治研究工作,E-mail:wangjingjing@scdc.sh.cn
    徐劲秋,女,主管医师,主要从事病媒生物防治研究工作,E-mail:xujingqiu@scdc.sh.cn
    第一联系人:

    王静静、徐劲秋为共同第一作者

Abstract:

Objective: To analyze the species, density, distribution, and variation of flies in Shanghai, China, to carry out risk assessment, prediction, and early warning of fly-borne diseases in a timely manner, so as to provide scientific reference for fly control. Methods: Using the cage trap method, fly traps were placed in farmers' markets, residential areas, external environment of restaurants, and large green belts. Fly surveillance data were collected every ten days from March to November in 2016-2021 in Shanghai. The data were processed and analyzed using Excel 2019 and SPSS 20.0. Results: From 2016 to 2021, 18 052 flies were caught with an average density of 1.52 flies/cage. The identified fly species belonged to 5 families, 9 genera, and 14 species. The dominant species were Muscina stabulans, Boettcherisca peregrina, Chrysomya megacephala, Lucilia sericata, and Musca domestica. M. stabulans showed the highest density of 0.28 flies/cage, followed by B. peregrina (0.24 flies/cage). In large green belts, the density of B. peregrina was higher than that of M. stabulans, and in all other habitats, the density of M. stabulans was the highest. There was a significant difference in density between B. peregrina and M. stabulans in the farmers' market (t=-2.674, P=0.023). The proportion of Mu. domestica decreased year by year, and the proportion of M. stabulans increased. The fly density was the highest in 2018 (1.82 flies/cage) and the lowest in 2016 (1.04 flies/cage). Fly density peaked from June to August, with the monthly average densities of 2.65, 2.49, and 2.28 flies/cage, respectively. In 2016-2021, the fly density in different habitats was in the order of farmers' markets > large green belts > residential areas > external environment of restaurants. Conclusions: The fly species are diverse in Shanghai. M. stabulans has the highest density. Fly density peaks from June to August, and farmer's market is a key place for targeted fly control. Fly density rose again after decline in 2019, suggesting that comprehensive control of flies should be continuously strengthened.

Key words: Fly species, Species composition, Fly density, Seasonal variation

摘要:

目的: 掌握上海市蝇的种类、密度、分布规律及其消长趋势,及时开展蝇类传播疾病风险评估和预测预警,为蝇类防制提供科学依据。方法: 采用笼诱法,在农贸市场、居民小区、餐饮外环境和大型绿化带开展监测;使用Excel 2019和SPSS 20.0软件,对上海市2016-2021年每年3-11月每旬各监测点蝇类监测数据进行汇总整理及统计分析。结果: 2016-2021年共捕蝇18 052只,平均密度为1.52只/笼,鉴定蝇种有5科9属14种,以厩腐蝇、棕尾别麻蝇、大头金蝇、丝光绿蝇和家蝇为优势种;厩腐蝇密度最高,为0.28只/笼,其次为棕尾别麻蝇,为0.24只/笼;除棕尾别麻蝇在大型绿化带中密度略高于厩腐蝇外,其他生境中均以厩腐蝇密度最高,二者在农贸市场的密度差异有统计学意义(t=-2.674,P=0.023);家蝇占比整体呈逐年下降趋势,厩腐蝇占比上升;蝇密度2018年最高,为1.82只/笼,2016年最低,为1.04只/笼;蝇密度高峰期为6-8月,月平均密度分别为2.65、2.49和2.28只/笼;2016-2021年,不同生境蝇密度依次是农贸市场 > 大型绿化带 > 居民小区 > 餐饮外环境。结论: 上海市蝇种丰富,以厩腐蝇密度最高,每年蝇密度高峰期在6-8月,农贸市场是蝇类防制的重点场所,蝇密度自2019年下降后再次升高,提示应持续加强蝇类综合防制。

关键词: 蝇类, 种类构成, 蝇密度, 季节消长

CLC Number: