中国媒介生物学及控制杂志 ›› 2022, Vol. 33 ›› Issue (6): 869-872.DOI: 10.11853/j.issn.1003.8280.2022.06.020

• 技术与方法 • 上一篇    下一篇

媒介蚊虫季节消长趋势分析方法的探讨与比较

李炳辉1,2, 刘砚涛1,2, 马小芳1,2, 王伟1,2, 宋富成1,2, 孙庚晓1,2, 姜洪荣1,2, 付齐齐1,2   

  1. 1. 青岛市疾病预防控制中心消毒与病媒防制所/学校卫生所, 山东 青岛 266033;
    2. 青岛市预防医学研究院, 山东 青岛 266033
  • 收稿日期:2022-06-30 出版日期:2022-12-20 发布日期:2022-12-09
  • 通讯作者: 付齐齐,E-mail:fuqiqi310@163.com
  • 作者简介:李炳辉,男,硕士,主管技师,主要从事消毒与病媒生物防制技术研究,E-mail:libinghuicdc@sina.com
  • 基金资助:
    山东省医药卫生科技发展计划(202012051157)

Discussion and comparison of methods for analyzing the seasonal fluctuation trend of mosquito vectors

LI Bing-hui1,2, LIU Yan-tao1,2, MA Xiao-fang1,2, WANG Wei1,2, SONG Fu-cheng1,2, SUN Geng-xiao1,2, JIANG Hong-rong1,2, FU Qi-qi1,2   

  1. 1. Department of Disinfection and Vector Control/School Health, Qingdao Center for Disease Control and Prevention, Qingdao, Shandong 266033, China;
    2. Qingdao Institute of Preventive Medicine, Qingdao, Shandong 266033, China
  • Received:2022-06-30 Online:2022-12-20 Published:2022-12-09
  • Supported by:
    Shandong Province Medical and Health Science and Technology Development Project (No. 202012051157)

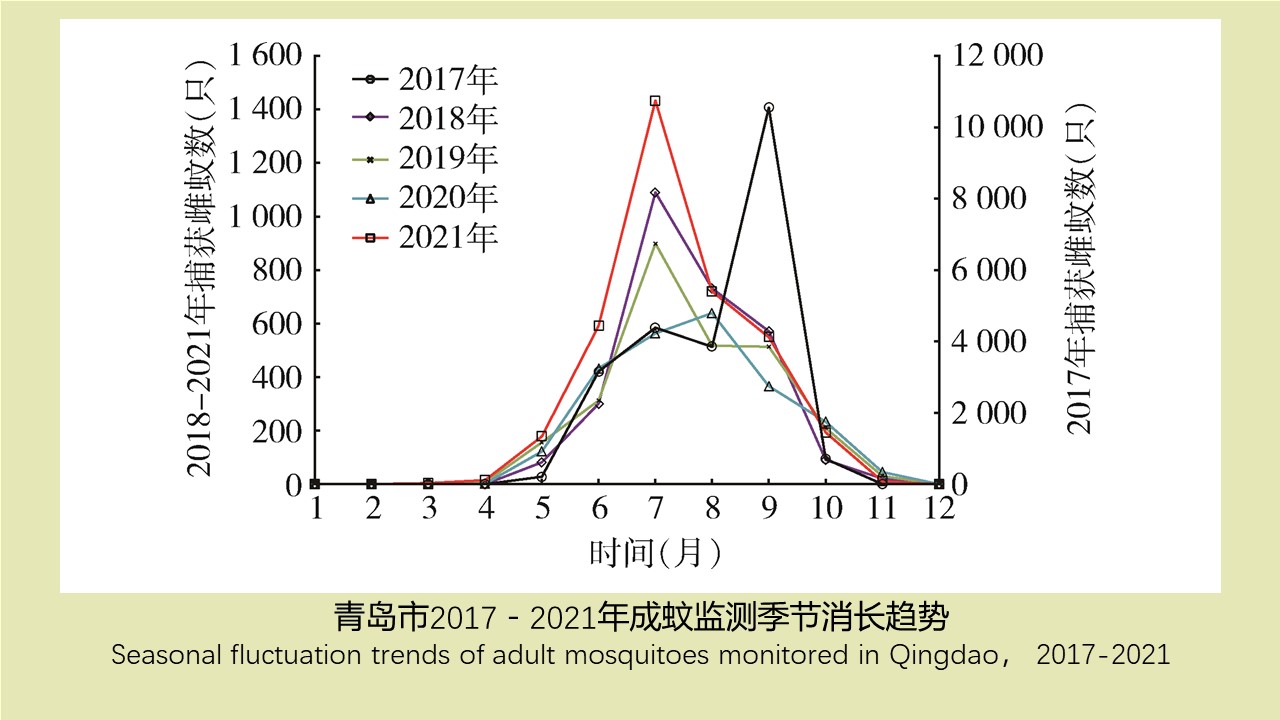
摘要: 目的 探讨并比较媒介蚊虫季节消长趋势分析的4种方法。方法 应用图示法、聚类分析法、季节指数法和游程检验法对青岛市蚊虫国家级监测点2017-2021年成蚊监测数据进行季节性分析,采用描述性分析的方法比较4种方法的应用效果。应用WPS 2012软件整理数据,并进行图示法和季节指数法分析,SPSS 23.0软件用于聚类分析法和游程检验法分析。结果 图示法、聚类分析法和季节指数法均得出成蚊消长趋势具有季节性特征,季节消长高峰期集中在6-9月;游程检验法得出成蚊消长趋势有季节性特征,且差异有统计学意义(Z=-2.119,P=0.034)。结论 4种方法均可用于媒介蚊虫季节消长趋势的分析和判定,图示法、聚类分析法和季节指数法能够获得季节消长的高峰时间段,而游程检验法能作出有无统计学意义的判断,研究者可根据分析目的和工作需要,灵活选用各类方法。

关键词: 媒介蚊虫, 季节性特征, 聚类分析, 季节指数, 游程检验

Abstract: Objective To discuss and compare four methods for analyzing the seasonal fluctuation trend of mosquito. Methods The graphic method, cluster analysis, seasonal index, and run test were used to seasonally analyze the monitoring data of adult mosquitoes at national mosquito monitoring sites in Qingdao, China, 2017-2021, and the application effects of four methods were compared by descriptive analysis. WPS 2012 software was used to collate data, and the graphic method and seasonal index analysis. SPSS 23.0 software was used for cluster analysis and run test analysis. Results Graph method, cluster analysis, and seasonal index showed that the fluctuation trend of adult mosquitoes had seasonal characteristics, and the peak of seasonal fluctuation was concentrated in June to September. The run test showed that the fluctuation trend of adult mosquitoes had statistically significant seasonal characteristics (Z=-2.119, P=0.034). Conclusion The four methods can be used to analyze and determine the seasonal fluctuation trend of mosquito. The peak period of seasonal fluctuation can be obtained by the graphic method, cluster analysis, and seasonal index, and the statistical significance can be determined by the run test. Researchers can flexibly choose or combine various methods according to their research objectives and work needs.

Key words: Mosquito, Seasonal characteristic, Cluster analysis, Seasonal index, Run test

中图分类号: