 PDF(728 KB)
 PDF(728 KB)
ISSN 1003-8280 CN 10-1522/R 中国疾病预防控制中心 主办
PDF(728 KB)
辽宁省2020年主要病媒生物监测结果分析
 ({{custom_author.role_cn}}), {{javascript:window.custom_author_cn_index++;}}
Surveillance results of the main vectors in Liaoning province of China in 2020
({{custom_author.role_en}}), {{javascript:window.custom_author_en_index++;}}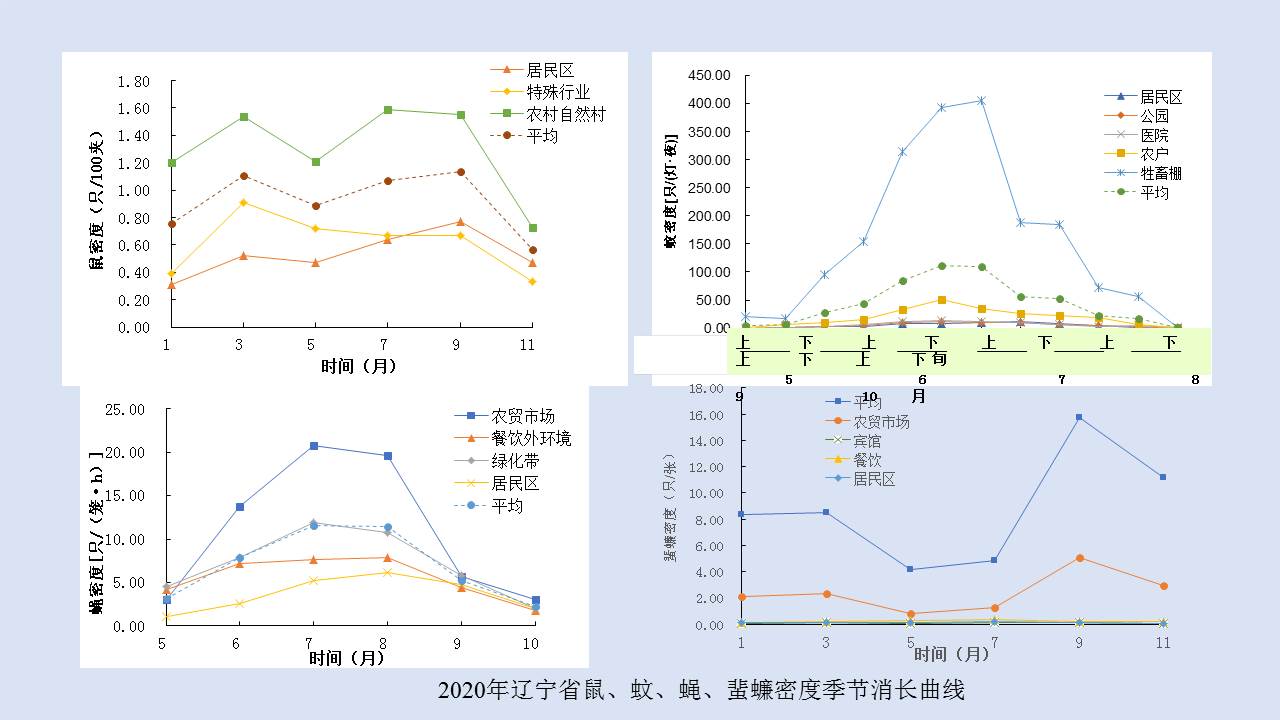
| {{custom_ref.label}} |
{{custom_citation.content}}
{{custom_citation.annotation}}
|
中国媒介生物学及控制杂志 © 2021 版权所有
地址:北京昌平区昌百路155号 电话:010-58900731
Email:bingmei@icdc.cn
网址:http://www.bmsw.net.cn
技术支持:010-62662699
总访问:
今日访问:
当前在线:
/
| 〈 |
|
〉 |


