中国媒介生物学及控制杂志 ›› 2022, Vol. 33 ›› Issue (1): 137-142.DOI: 10.11853/j.issn.1003.8280.2022.01.025

• 技术与方法 • 上一篇    下一篇

CO2诱蚊灯法监测淡色库蚊的时间频次模型研究

周毅彬, 姚隽一, 朱奕奕, 朱江, 冷培恩, 吴寰宇   

  1. 上海市疾病预防控制中心传染病防治所, 上海 200336
  • 收稿日期:2021-06-30 出版日期:2022-02-20 发布日期:2022-02-17
  • 通讯作者: 吴寰宇,中心副主任,E-mail:wuhuanyu@scdc.sh.cn
  • 作者简介:周毅彬,男,博士,副主任医师,主要从事病媒生物研究工作,E-mail:zhouyibin@scdc.sh.cn;姚隽一,男,技师,主要从事媒介疾病研究工作,E-mail:yaojuanyi@scdc.sh.cn
  • 基金资助:
    上海市卫生健康委员会科研项目(201940350);上海市第五轮公共卫生体系建设三年行动计划重点学科项目(GWV-10.1-XK13);病原微生物生物安全国家重点实验室开放基金(SKLPBS2128)

A study of time-frequency model for monitoring Culex pipiens pallens by CO2 mosquito lamps

ZHOU Yi-bin, YAO Jun-yi, ZHU Yi-yi, ZHU Jiang, LENG Pei-en, WU Huan-yu   

  1. Institute for Prevention and Control of Infectious Diseases, Shanghai Center for Disease Control and Prevention, Shanghai 200336, China
  • Received:2021-06-30 Online:2022-02-20 Published:2022-02-17
  • Supported by:
    Shanghai Municipal Health Commission (No. 201940350); Fifth Round of Three-year Action for Public Health System Construction in Shanghai (No. GWV-10.1-XK13); State Key Laboratory of Pathogen and Biosecurity (No. SKLPBS2128)

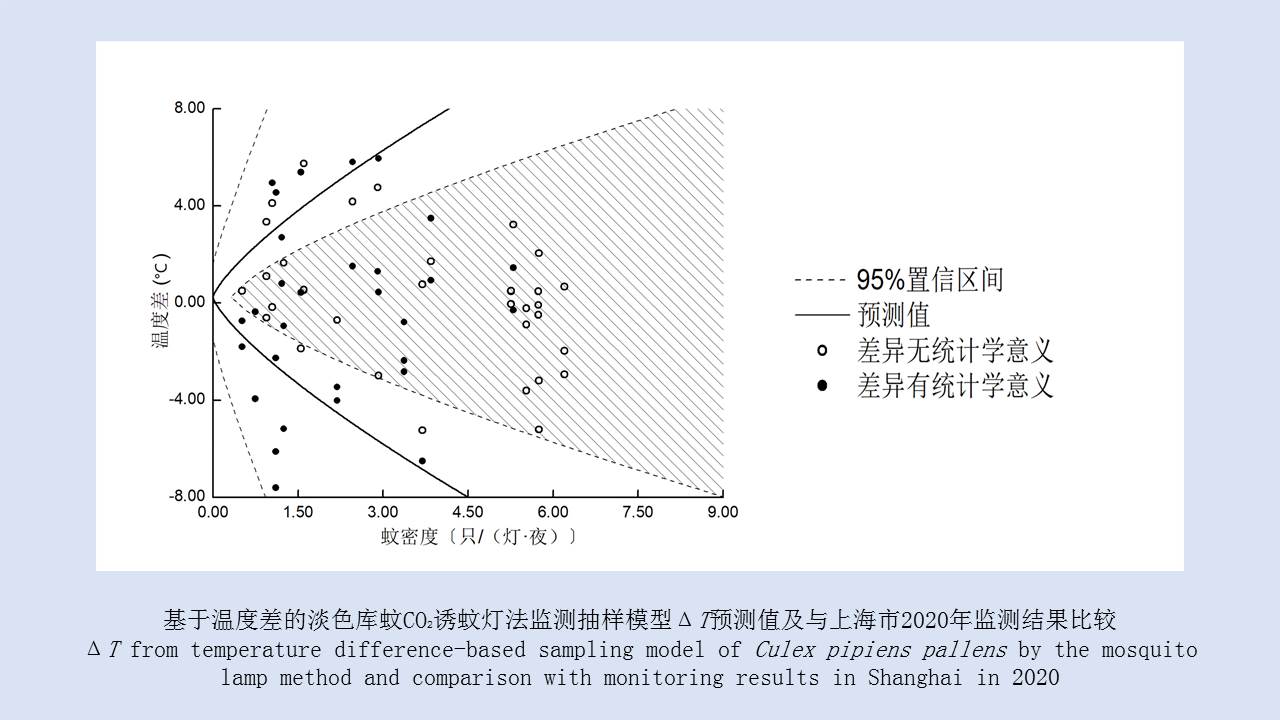
摘要: 目的 建立基于温度差的CO2诱蚊灯抽样模型,为CO2诱蚊灯监测频次的确定提供科学依据。方法 在上海市15个区,于2019和2020年的4-11月每旬设置229个CO2诱蚊灯监测1次淡色库蚊密度。以2019年的监测数据为训练集,2020年的监测数据为测试集。通过泰勒幂法则建立均数与标准差间的函数,代入两样本均数比较的样本量公式,建立基于密度差的抽样模型。使用线性回归模型建立临近2次CO2诱蚊灯监测结果密度差和该2次监测前1旬的温度差的回归方程,代入基于密度差的抽样模型,建立基于温度差的抽样模型。两样本均数比较使用Wilcoxon秩和检验,模型验证使用准确率、召回率和调和平均值(F-measure)进行评价。结果 2019年相邻2旬、间隔1旬、间隔2旬淡色库蚊监测密度比较,均值差异均有统计学意义(Wilcoxon秩和检验,均P<0.05),占比分别为34.78%、59.09%和76.19%;2020年相邻2旬、间隔1旬和间隔2旬密度比较,均值的差异有统计学意义(均P<0.05),占比分别为21.74%、59.09%和66.67%。以2020年数据验证基于温度差的抽样模型,准确率为0.563,召回率为0.720,F-measure为0.632。结论 基于温度差的抽样模型具备实用意义,可以根据温度差估算CO2诱蚊灯监测的最佳监测频次。目前上海市的CO2诱蚊灯监测每年4-11月每旬监测1次,建议间隔1旬开展监测,并根据温度变化适当增加频次。

关键词: CO2诱蚊灯, 时间频次, 淡色库蚊

Abstract: Objective To build a temperature difference-based CO2 mosquito lamp sampling model, and to provide evidence for CO2 mosquito lamp monitoring frequency. Methods A total of 229 CO2mosquito lamps were set to monitor the density of Culex pipiens pallens every ten days (defined as one period) from April to November in 15 districts of Shanghai, China. The monitoring data of 2019 were used as the training set, and those of 2020 were used as the test set. A function of mean and standard deviation was established based on Taylor’s power law, and the sample size formula for mean comparison between two samples was substituted into the function to establish a sampling model based on density difference. A linear regression model was used to establish a regression equation of the density difference between two adjacent monitoring activities and the temperature difference (during 10 days before monitoring) between two monitoring activities. The density difference-based sampling model was substituted to construct a temperature difference-based sampling model. The Wilcoxon rank-sum test was used for mean comparison between two samples. The model was validated using accuracy, recall, and F-measure. Results In the density difference-based sampling model, for both 2019 and 2020, the difference in mean mosquito density was significant between two adjacent periods(all P<0.05), between two periods with an interval of one period(all P<0.05), and between two periods with an interval of two periods(all P<0.05), accounting for 34.78%, 59.09%, and 76.19% in 2019, respectively, and 21.74%,59.09%, and 66.67% in 2020, respectively. In the validation of the temperature difference-based sampling model with the data of 2020, the accuracy was 0.563, the recall was 0.720, and the F-measure was 0.632. Conclusion The temperature difference-based sampling model is practical, which can estimate the optimal frequency of CO2 mosquito lamp monitoring based on temperature difference. CO2 mosquito lamp monitoring frequency in Shanghai from April to November can be adjusted from once every 10 days at present to once every 20 days, and can be increased based on temperature changes.

Key words: CO2mosquito lamp, Time-frequency, Culex pipiens pallens

中图分类号: