中国媒介生物学及控制杂志 ›› 2022, Vol. 33 ›› Issue (1): 100-103.DOI: 10.11853/j.issn.1003.8280.2022.01.018

• 媒介生物监测 • 上一篇    下一篇

山东省聊城市国家级监测点2018-2020年鼠类监测结果分析

闫青芳1, 赵洪林1, 姜健康1, 杜桂英1, 刘淑霞1, 宁吉沪1, 陈立勇1, 王光伟2   

  1. 1. 聊城市疾病预防控制中心消毒与病媒生物防制所, 山东聊城 252000;
    2. 聊城市东昌府区市场监督管理局, 山东 聊城 252000
  • 收稿日期:2021-08-31 出版日期:2022-02-20 发布日期:2022-02-17
  • 通讯作者: 王光伟,E-mail:wgw13869570002@126.com
  • 作者简介:闫青芳,女,副主任医师,主要从事消毒与病媒防制工作,E-mail:lccdcyqf@126.com

Rodent surveillance results of national surveillance sites in Liaocheng city of Shandong province, China, 2018-2020

YAN Qing-fang1, ZHAO Hong-lin1, JIANG Jian-kang1, DU Gui-ying1, LIU Shu-xia1, NING Ji-hu1, CHEN Li-yong1, WANG Guang-wei2   

  1. 1. Disinfection and Vector Control Institute, Liaocheng Center for Disease Control and Prevention, Liaocheng, Shandong 252000, China;
    2. Market Supervision and Administration Bureau in Dongchangfu District of Liaocheng, Liaocheng, Shandong 252000, China
  • Received:2021-08-31 Online:2022-02-20 Published:2022-02-17

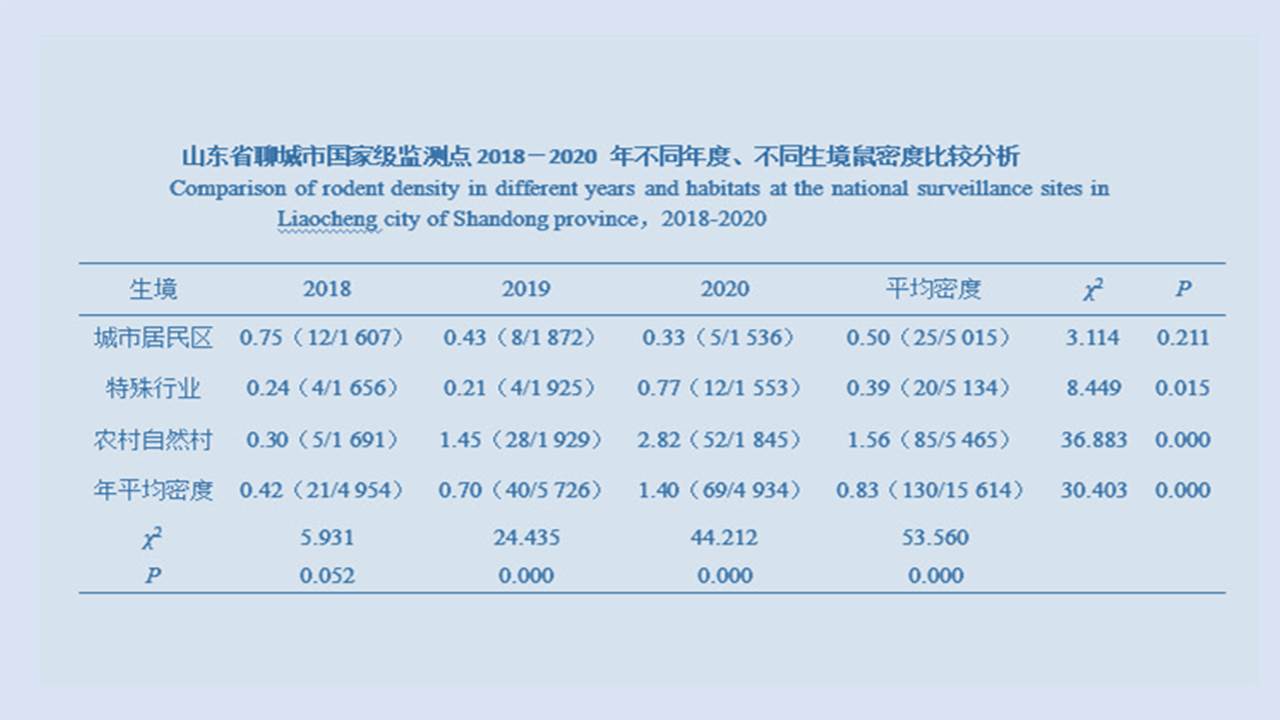
摘要: 目的 了解山东省聊城市国家级监测点2018-2020年人居及周边环境鼠种类构成、密度及季节消长变化情况,为鼠类防控提供科学依据。方法 根据中国疾病预防控制中心《全国病媒生物监测实施方案》要求,采用夹夜法监测鼠密度,每2个月(单月监测)监测1次,每监测月中旬开展监测,2次监测时间间隔不小于30 d,设置城镇居民区、特殊行业和农村自然村3类生境为监测点,每个监测点布放有效夹≥200夹。监测数据利用Excel 2007和SPSS 17.0软件进行统计分析,不同年度和不同生境鼠密度差异比较采用χ2检验。结果 2018-2020年总体鼠密度为0.83%,小家鼠、褐家鼠、黑线姬鼠构成比分别为55.38%、42.31%和2.31%,小家鼠密度最高。3年平均鼠密度分别为0.42%、0.70%和1.40%,呈逐年上升的趋势,鼠密度差异有统计学意义(χ2=30.403,P<0.001)。城镇居民区、特殊行业、农村自然村鼠密度分别为0.50%、0.39%和1.56%,农村自然村高于城镇居民区和特殊行业,鼠密度差异有统计学意义(χ2=28.124,P<0.001;χ2=36.680,P<0.001)。3年鼠密度季节消长趋势不同,2018年鼠密度出现2个高峰,峰值在5和11月;2019年鼠密度出现1个高峰,峰值在7月;2020年鼠密度出现1个高峰,峰值在3月。城镇居民区鼠密度高峰出现在7和11月,特殊行业鼠密度高峰出现在5和9月,农村自然村鼠密度高峰出现在5月。小家鼠鼠密度高峰出现在5月,褐家鼠密度基本呈现逐月上升趋势,黑线姬鼠密度高峰出现在11月。结论 山东省聊城市鼠类国家级监测点2018-2020年优势鼠种主要是小家鼠,其次是褐家鼠。农村自然村是鼠类防控重点地区,建议根据鼠类的孳生、栖息习性及季节消长特点,采取综合长效防治措施。

关键词: 鼠密度, 分类, 监测

Abstract: Objective To investigate the species, density, and seasonal variation of rodents in human settlements and surrounding environment at national surveillance sites in Liaocheng city of Shandong province, China, in 2018-2020, and to provide a scientific basis for rodent prevention and control. Methods According to the requirements in the National Vector Surveillance Implementation Scheme developed by Chinese Center for Disease Control and Prevention, the trap-at-night method was used to monitor rodent density once every 2 months (in odd months) during the middle ten days of each month for surveillance, with an interval of no less than 30 days between surveillance. The three habitats of urban residential areas, special industry, and rural residential areas were established as the surveillance sites, and no less than 200 effective traps were placed at each surveillance site. Excel 2007 and SPSS 17.0 softwares were used to perform a statistical analysis of surveillance data, and the Chi-square test was used for comparison of rodent density across different years and habitats. Results The overall rodent density was 0.83% in 2018-2020, and the composition ratios of Mus musculus, Rattus norvegicus, and Apodemus agrarius were 55.38%, 42.31%, and 2.31%, respectively, with the highest rodent density of M. musculus. The mean rodent density in the three years was 0.42%, 0.70%, and 1.40%, respectively, which showed an increasing trend year by year, and there was a statistical difference in rodent density across the years (χ2=30.403, P<0.001). The rodent density was 0.50% in urban residential areas, 0.39% in special industries, and 1.56% in rural natural villages, suggesting that rural natural villages had a significantly higher rodent density than urban residential areas and special industries, and there was a statistical difference in rodent density (χ2=28.124, P<0.001; χ2=36.680, P<0.001). Inconsistency was observed in the trend of seasonal variation of rodent density in the three years, with two peaks in May and November of 2018, one peak in July 2019, and one peak in March 2020. The peak of rodent density was observed in July and November in urban residential areas, the peak of rodent density was observed in May and September in special industries, and the peak of rodent density was observed in May in rural natural villages. The peak density of M. musculus was observed in May, the density of R. norvegicus basically showed an increasing trend from month to month, and the peak density of A. agrarius was observed in November. Conclusion M. musculus is the dominant species of rodents at the national surveillance sites in Liaocheng city of Shandong province, followed by R. norvegicus. Rural natural villages will be the focus of rodent prevention and control in the future, and it is recommended to take the comprehensive long-acting prevention and control measures according to their breeding, perching habits, and seasonal variation.

Key words: Rodent density, Classification, Surveillance

中图分类号: