
1 材料与方法
1.1 数据来源与处理
1.2 统计分析
1.3 预测模型构建
1.3.1 MSR模型
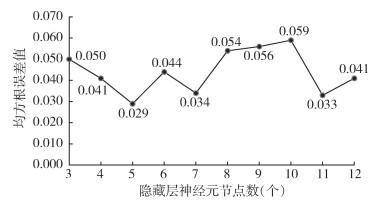
1.3.2 BPNN模型
1.4 模型精度评价
表1 新疆维吾尔自治区大沙鼠鼠疫自然疫源地古尔班通古特沙漠动物鼠疫流行强度分级Tab. 1 Animal plague epizootic intensities classification in the Gurbantunggut Desert at the natural foci of great gerbil plague in Xinjiang Uygur Autonomous Region |
| 大沙鼠血清鼠疫菌F1抗体阳性率(%) | 对应流行强度分级 |
| 0 | 0 |
| 0 < X≤4.10 | 1 |
| 4.10 < X≤9.40 | 2 |
| 9.40 < X≤16.90 | 3 |
| X > 16.90 | 4 |
注:X代表抗体阳性率。 |
2 结果
2.1 动物鼠疫监测结果
表2 2005-2016年新疆维吾尔自治区大沙鼠鼠疫自然疫源地古尔班通古特沙漠动物鼠疫监测结果Tab. 2 Surveillance data of animal plague in the Gurbantunggut Desert at the natural foci of great gerbil plague in Xinjiang Uygur Autonomous Region, 2005-2016 |
| 年份 | 阳性率b(%) | 染蚤率(%) | 蚤指数 | 鼠密度(只/hm2) | 洞群覆盖率(%) | 洞群栖息率(%) | 洞群密度(个/hm2) |
| 2005 | 7.00 | 93.10 | 14.77 | - | 33.00 | 72.00 | 25.36 |
| 2006 | 13.40 | 87.20 | 6.30 | 8.52 | 24.00 | 77.00 | 12.08 |
| 2007 | - | - | - | 22.6 | 11.00 | - | - |
| 2008 | 1.60 | 74.00 | 11.41 | 8.35 | 6.00 | 37.00 | 6.78 |
| 2009 | 11.20 | 91.70 | 14.98 | 4.68 | 22.00 | 88.00 | 1.78 |
| 2010 | 2.80 | 82.60 | 10.58 | 1.78 | 20.00 | 67.00 | 1.39 |
| 2011 | 3.70 | 79.00 | 8.39 | 2.77 | 25.00 | 82.00 | 1.45 |
| 2012 | 8.50 | 95.40 | 12.35 | 6.63 | 22.00 | 97.00 | 1.24 |
| 2013 | 20.80 | 89.00 | 5.23 | 12.13 | 35.00 | 87.00 | 2.35 |
| 2014 | 20.40 | 97.00 | 9.86 | 16.39 | 49.00 | 86.00 | 3.28 |
| 2015 | 18.10 | 79.00 | 14.61 | 6.89 | 29.00 | 62.00 | 3.56 |
| 2016 | 5.30 | 91.40 | 7.95 | 8.46 | 26.00 | 77.00 | 3.17 |
| 平均值a | 10.25±6.73 | 87.22±7.19 | 10.58±3.25 | 9.02±5.80 | 25.17±10.64 | 75.64±15.54 | 5.68±6.93 |
注:a平均值用 |
2.2 气象资料分布
表3 新疆维吾尔自治区大沙鼠鼠疫自然疫源地古尔班通古特沙漠气象资料统计Tab. 3 Statistics of meteorological data of the Gurbantunggut Desert at the natural foci of great gerbil plague in Xinjiang Uygur Autonomous Region |
| 变量 | 平均值 | 最小值 | 中位数 | 最大值 |
| 年降水量(mm) | 225.6 | 126.7 | 224.9 | 319.5 |
| 秋末冬春降水量(mm) | 79.5 | 43.0 | 78.6 | 128.4 |
| 春末夏秋降水量(mm) | 146.1 | 79.8 | 159.3 | 232.7 |
| 年日照时数(h) | 2 590.7 | 2 143.3 | 2 615.4 | 2 774.0 |
| 秋末冬春日照时数(h) | 773.6 | 471.5 | 771.1 | 900.3 |
| 春末夏秋日照时数(h) | 1 817.1 | 1 671.6 | 1 832.7 | 1 906.8 |
2.3 影响血清抗体阳性率相关因子筛选
2.3.1 鼠疫生物学监测因子
2.3.2 气象因子
表4 大沙鼠鼠疫自然疫源地古尔班通古特沙漠气象因子与大沙鼠血清鼠疫耶尔森菌抗体阳性率相关性Tab. 4 Correlation between meteorological factors and serum yersinia pestis antibody positivity rate in the Gurbantunggut Desert at the natural foci of great gerbil plague |
| 气象因子 | 相关系数 | P值 |
| 年均降水量 | 0.082 | 0.811 |
| 滞后1年年均降水 | -0.609 | 0.047 |
| 春末夏秋平均降水 | 0.291 | 0.385 |
| 滞后1年春末夏秋平均降水 | -0.278 | 0.408 |
| 秋末冬春平均降水 | -0.127 | 0.709 |
| 滞后1年秋末冬春平均降水 | -0.127 | 0.709 |
| 年均日照时数 | 0.087 | 0.800 |
| 滞后1年年均日照时数 | 0.533 | 0.091 |
| 春末夏秋平均日照时数 | 0.087 | 0.800 |
| 滞后1年春末夏秋平均日照时数 | 0.645 | 0.032 |
| 秋末冬春平均日照时数 | 0.000 | 1.000 |
| 滞后1年秋末冬春平均日照时数 | 0.427 | 0.190 |
2.4 预测模型构建
2.4.1 MSR模型
表5 大沙鼠鼠疫自然疫源地鼠疫生物学监测因子和气象因子与大沙鼠血清鼠疫耶尔森菌抗体阳性率多元线性逐步回归模型结果Tab. 5 Results of multiple linear stepwise regression model of biological and meteorological factors and serum Yersinia pestis antibody positivity rate at the natural foci of great gerbil plague |
| 参数 | 非标准化系数 | 标准化系数(β值) | t值 | P值 | R²值 | F检验 | ||
| B值 | 标准误 | F值 | P值 | |||||
| 常量 | 0.003 | 0.038 | - | 0.090 | 0.931 | 0.495 | 7.849 | 0.023 |
| 洞群覆盖率 | 0.390 | 0.139 | 0.704 | 2.802 | 0.023 | |||
注:- 表示值空缺。 |
2.4.2 BPNN模型
2.5 2种模型预测精度评价
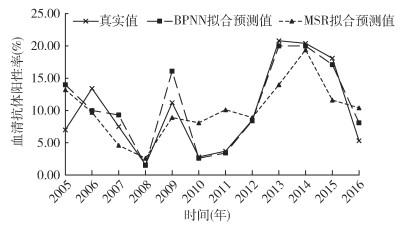
图2 大沙鼠鼠疫自然疫源地动物鼠疫2种模型拟合预测图注:BPNN反向传播神经网络模型;MSR多元线性逐步回归模型。 Fig. 2 Fitting plots of the two prediction models for animal plague at the natural foci of great gerbil plague |
表6 大沙鼠鼠疫自然疫源地动物鼠疫2种预测模型训练及测试结果Tab. 6 Training and test results of the two prediction models for animal plague at the natural foci of great gerbil plague |
| 样本 | 年份 | 实际阳性率(%) | 流行强度分级 | MSR预测阳性率(%) | 流行强度分级 | BPNN预测阳性率(%) | 流行强度分级 |
| 训练集 | 2005 | 7.00 | 2 | 13.20 | 3 | 14.00 | 3 |
| 2006 | 13.40 | 3 | 9.70 | 3 | 10.00 | 3 | |
| 2007 | 10.30 | 3 | 4.60 | 2 | 9.30 | 2 | |
| 2008 | 1.60 | 1 | 2.60 | 1 | 1.50 | 1 | |
| 2009 | 11.20 | 3 | 8.90 | 2 | 16.10 | 3 | |
| 2010 | 2.80 | 1 | 8.10 | 2 | 2.60 | 1 | |
| 2011 | 3.70 | 1 | 10.10 | 3 | 3.40 | 1 | |
| 2012 | 8.50 | 2 | 8.90 | 2 | 8.40 | 2 | |
| 2013 | 20.80 | 4 | 14.00 | 3 | 20.00 | 4 | |
| 2014 | 20.40 | 4 | 19.40 | 4 | 20.00 | 4 | |
| 测试集 | 2015 | 18.10 | 4 | 11.60 | 3 | 17.10 | 4 |
| 2016 | 5.30 | 2 | 10.40 | 3 | 8.10 | 2 |
注:阳性率为大沙鼠血清鼠疫耶尔森菌F1抗体阳性率;MSR为多元线性逐步回归;BPNN为反向传播神经网络模型。 |
表7 大沙鼠鼠疫自然疫源地动物鼠疫2种模型拟合预测精度比较Tab. 7 Comparison of prediction accuracy of the two models for animal plague at the natural foci of great gerbil plague |
| 模型 | 训练集 | 测试集 | |||||
| RMSE | MAPE | R2值 | RMSE | MAPE | R2值 | ||
| MSR | 0.046 | 0.659 | 0.496 | 0.058 | 0.661 | 0.167 | |
| BPNN | 0.029 | 0.209 | 0.790 | 0.021 | 0.292 | 0.892 | |
注:BPNN反向传播神经网络模型;MSR多元线性逐步回归模型;R2决定系数;RMSE均方根误差;MAPE平均绝对百分比误差。 |