Chinese Journal of Vector Biology and Control ›› 2022, Vol. 33 ›› Issue (5): 696-700.DOI: 10.11853/j.issn.1003.8280.2022.05.015

• Vector Surveillance • Previous Articles     Next Articles

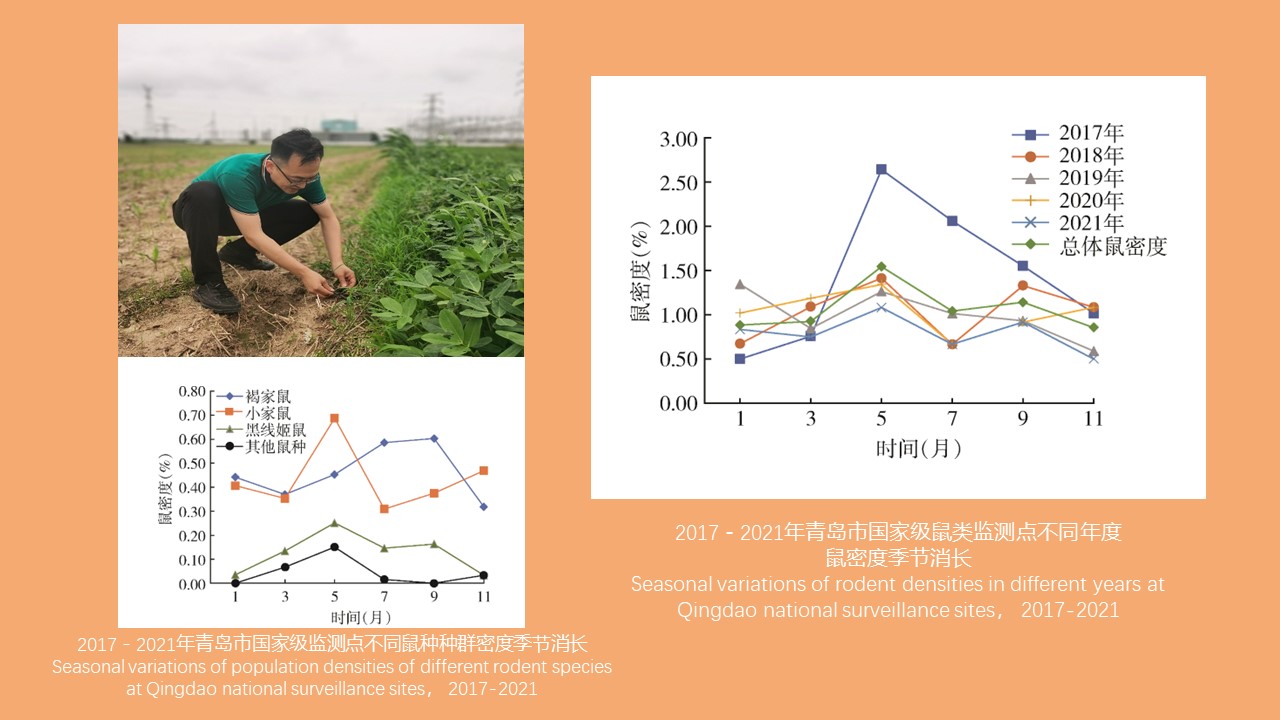
Surveillance report on rodents at national rodent surveillance sites of Qingdao,China,2017-2021

SONG Fu-cheng1,2, XIU Jing-wei1,2, WANG Wei1,2, MA Xiao-fang1,2, LI Bing-hui1,2, SUN Geng-xiao1,2, SUN Qin-tong3, JIANG Hong-rong1,2, LIU Yan-tao1,2   

  1. 1. Disinfection and Vector Control Institute, Qingdao Center for Disease Control and Prevention, Qingdao, Shandong 266033, China;
    2. Qingdao Institute of Preventive Medicine, Qingdao, Shandong 266033, China;
    3. Shandong Center for Disease Control and Prevention, Ji'nan, Shandong 250014, China
  • Received:2022-04-24 Online:2022-10-20 Published:2022-10-14
  • Supported by:
    Medical Health Science and Technology Development Project of Shandong Province (No.202012051157)

2017-2021年青岛市国家级鼠类监测点监测报告

宋富成1,2, 修璟威1,2, 王伟1,2, 马小芳1,2, 李炳辉1,2, 孙庚晓1,2, 孙钦同3, 姜洪荣1,2, 刘砚涛1,2   

  1. 1. 青岛市疾病预防控制中心消毒与病媒防制所, 山东青岛 266033;
    2. 青岛市预防医学研究院, 山东 青岛 266033;
    3. 山东省疾病预防控制中心, 山东济南 250014
  • 通讯作者: 刘砚涛,E-mail:lyt0102@sina.com
  • 作者简介:宋富成,男,硕士,主管医师,主要从事消毒与病媒生物防制工作,E-mail:qdsongfucheng@126.com
  • 基金资助:
    山东省医药卫生科技发展计划(202012051157)

Abstract: Objective To investigate the species composition,population density,habitat distribution,and seasonal variation of rodents at national surveillance sites of Qingdao,Shandong province,China,and to provide a scientific basis for rodent control.Methods From 2017 to 2021,the trap-at-night method was used to monitor rodents once every two months (in the middle period of odd months) in urban residential areas,key industry areas,and rural residential areas of Qingdao,and no less than 200 effective traps were placed at each habitats.Excel 2010 and SPSS 19.0 softwares were used for statistical analysis of surveillance data,and the Chi-square test was used for comparison of rodent density.Results A total of 382 rodents were captured from 2017 to 2021.The overall rodent density was 1.07%.Except for a slight increase in 2020,the overall rodent density showed a downward trend,with a significant difference in the rodent densities in different years (χ2=15.141, P=0.004).Rattus norvegicus,Mus musculus,and Apodemus agrarius accounted for 43.45%,40.58%,and 11.78%,respectively.The rodent density was 0.87% in urban residential areas,0.45% in key industry areas,and 1.81% in rural residential areas.The density of M.musculus was highest in urban residential areas (0.48%),while the density of R.norvegicus was highest in rural residential areas (0.79%).The rodent density in rural residential areas showed a decreasing trend,with a significant difference between different years (χ2=237.008,P<0.001).The distributions of the peak months of rodent density seasonal fluctuations in the five years slightly differed,but all with the highest peak in May.The density peaks of M.musculus and A.agrarius occurred in May,and that of R.norvegicus was in September.The rodent density peaked in May in urban residential areas,in July in key industry areas,and in May and September in rural residential areas.Conclusion R.norvegicus and M.musculus were the dominant rodent species in the residential areas and surrounding environment of national rodent surveillance sites in Qingdao from 2017 to 2021.The density of rodents peaked in May,and it was higher in rural residential areas than in the other two habitats.We recommend strengthening rodent control in key areas according to rodents'seasonal fluctuations.

Key words: Rodent density, Rodent species composition, Seasonal fluctuation, Surveillance

摘要: 目的 了解青岛市国家级监测点鼠种构成、种群密度、生境分布及季节消长情况,为指导鼠类防控提供科学依据。方法 2017-2021年单月中旬采用夹夜法在青岛市国家级鼠类监测点的城镇居民区、重点行业、农村居民区3种生境进行监测,各生境布放有效夹≥200夹。采用Excel 2010和SPSS 19.0软件对监测数据进行统计分析,鼠密度差异比较采用χ2检验。结果 2017-2021年共捕获鼠形动物(以下统称鼠)382只,总体鼠密度为1.07%,除2020年略有上升外,总体鼠密度呈下降趋势,不同年份鼠密度差异有统计学意义(χ2=15.141,P=0.004)。褐家鼠、小家鼠、黑线姬鼠的构成比分别为43.45%、40.58%和11.78%。城镇居民区、重点行业、农村居民区的鼠密度分别为0.87%、0.45%和1.81%,城镇居民区小家鼠密度最高(0.48%),农村居民区褐家鼠密度最高(0.79%);农村居民区鼠密度呈下降趋势,不同年份鼠密度差异有统计学意义(χ2=237.008,P<0.001)。5年鼠密度季节消长趋势高峰月分布略有不同,但均在5月出现最高峰。小家鼠和黑线姬鼠密度高峰期在5月,褐家鼠在9月。城镇居民区鼠密度高峰在5月,重点行业鼠密度高峰在7月,农村居民区鼠密度高峰在5和9月。结论 2017-2021年青岛市国家级鼠类监测点人居及周边环境优势鼠种为褐家鼠、小家鼠;5月为鼠密度高峰期,农村居民区鼠密度高于其他2种生境。建议根据鼠类季节消长规律加大对重点区域的防鼠灭鼠工作。

关键词: 鼠密度, 鼠种构成, 季节消长, 监测

CLC Number: