Chinese Journal of Vector Biology and Control ›› 2022, Vol. 33 ›› Issue (1): 25-29.DOI: 10.11853/j.issn.1003.8280.2022.01.005

Special Issue: 登革热媒介伊蚊专项调查专题

• Special Investigation on Dengue Vectors Topics • Previous Articles     Next Articles

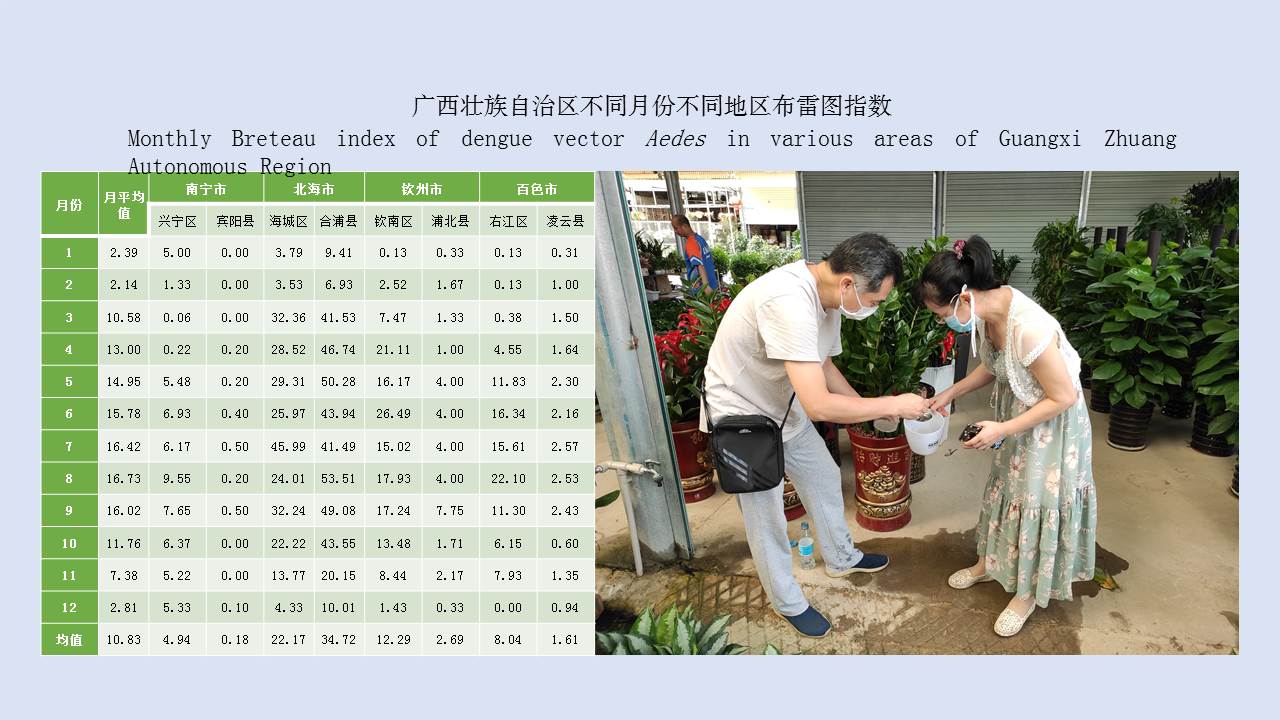
An analysis of special investigation results of dengue vector Aedes density in Guangxi Zhuang Autonomous Region, China, 2020-2021

WEI Chao, MA Hai-fang, LIAO Ning, XIONG Qi-meng   

  1. Division of Disinfection and Vector Control, Guangxi Center for Disease Control and Prevention, Nanning, Guangxi 530025, China
  • Received:2021-10-19 Online:2022-02-20 Published:2022-02-17
  • Supported by:
    Special Project of Chinese Center for Disease Control and Prevention "Special investigation on dengue vectors Aedes"

广西壮族自治区2020-2021年登革热媒介伊蚊密度专项调查结果分析

魏超, 马海芳, 廖宁, 熊绮梦   

  1. 广西壮族自治区疾病预防控制中心消杀与媒介防制所, 广西南宁 530025
  • 作者简介:魏超,男,硕士,助理研究员,主要从事病媒生物防治工作,E-mail:330885762@qq.com
  • 基金资助:
    中国疾病预防控制中心专题项目“登革热媒介伊蚊专项调查”

Abstract: Objective To investigate the dengue vector Aedes density and seasonal fluctuation in Nanning, Beihai, Qinzhou, and Baise, Guangxi Zhuang Autonomous Region, China, and to provide a strong basis for the scientific prevention of dengue fever. Methods According to the "Special investigation of dengue vector Aedes" issued by Chinese Center for Disease Control and Prevention, the Breteau index (BI) method, the mosq-ovitrap index (MOI) method, and the double-layered mosquito net method were used to monitor the density of larval and adult Ae. albopictus mosquitoes in 2020-2021. ArcGIS 10.5 software was used to plot the spatial distribution of surveillance sites of vector Aedes. SPSS 16.0 software and the one-sample t-test were used to perform the statistical analysis. Results In 2020-2021, the overall mean BI, MOI, and net trap index at all surveillance sites were 10.83, 9.39, and 2.04 mosquitoes/net·hour, respectively. According to the statistical analysis, At most surveillance sites, there were statistical differences between BI and the overall mean BI (all P<0.05), between the net trapping index and the overall mean net trap index (all P<0.05). At half of the surveillance sites, there were no statistical difference between MOI and the overall mean MOI (all P>0.05). The BI at all surveillance sites was higher than 5.00 from March to November, and reached the peak value (16.73) in August. The MOI at all surveillance sites was higher than 5.00 from April to October, and reached the peak value (20.86) in July. The net trap index at all surveillance sites was higher than 2.00 mosquitoes/net·hour from May to September, and reached the peak value (4.57 mosquitoes/net·hour) in July. Conclusion The density of Aedes mosquitoes in Guangxi Zhuang Autonomous Region is at a relatively high level. The results suggested it is urgent to carry out the prevention and control of adult Aedes mosquitoes from July to August and the breeding sites cleaning of Aedes larvae from August to September, so as to control the mosquito density below the safety threshold and reduce the risk of dengue outbreak.

Key words: Aedes albopictus, Density, Dengue fever, Surveillance

摘要: 目的 了解广西壮族自治区(广西)南宁、北海、钦州和百色市的登革热媒介伊蚊密度及季节消长情况,为科学防范登革热提供有力依据。方法 根据中国疾病预防控制中心《登革热媒介伊蚊专项调查》要求,2020-2021年采用布雷图指数(BI)法、诱蚊诱卵器法和双层叠帐法对白纹伊蚊幼蚊和成蚊密度进行监测;运用ArcGIS 10.5软件进行媒介伊蚊监测点分布图制作;采用SPSS 16.0软件和单样本t检验的方法进行统计学分析。结果 各监测点2020-2021年总BI、诱蚊诱卵指数(MOI)和帐诱指数平均值分别为10.83、9.39和2.04只/(顶·h)。经统计学分析大多数监测点BI法和双层叠帐法监测结果与总平均值比较差异有统计学意义(均P<0.01),诱蚊诱卵器法有一半监测点的MOI与总平均值比较差异无统计学意义(均P>0.05)。各监测点平均BI值3-11月均>5.00,8月达到峰值(16.73); MOI平均值4-10月均>5.00,7月达到峰值(20.86);平均帐诱指数5-9月均>2.00只/(顶·h),7月达到峰值,为4.57只/(顶·h)。结论 广西伊蚊密度处于相对较高的水平,建议在7-8月开展伊蚊成蚊密度的防控工作,8-9月开展伊蚊幼蚊的孳生地清理工作,将伊蚊密度控制在安全阈值之下,降低登革热暴发风险。

关键词: 白纹伊蚊, 密度, 登革热, 监测

CLC Number: